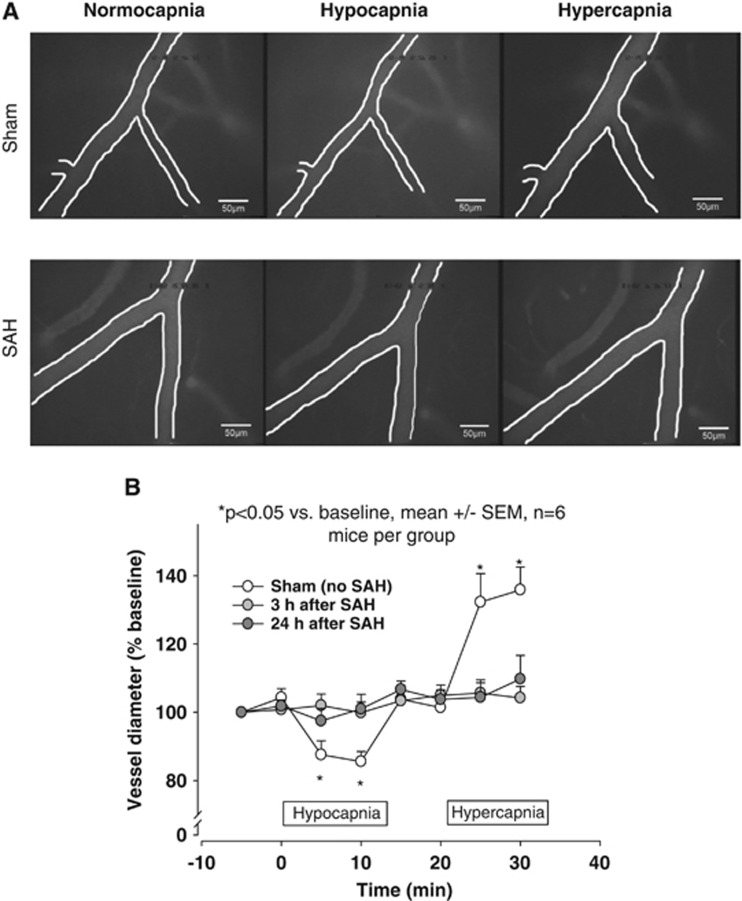
Figure 2.
(A) In vivo microscopy images of mouse pial arterioles and their response to various ventilation frequencies 3 hours after sham surgery (upper panels) or SAH (lower panels). For each animal, the left, middle, and right panels show the same vessel. (B) Quantification of these data show that sham-operated mice exhibited a significant decrease and increase in vessel diameter during hypocapnia and hypercapnia, respectively (open circles). In contrast, vessels in mice that underwent SAH showed no change in vessel diameter in response to various ventilation frequencies (gray circles). SAH, subarachnoid hemorrhage; SEM, standard error of the mean. *P<0.05 versus baseline; n=6 mice per group.

