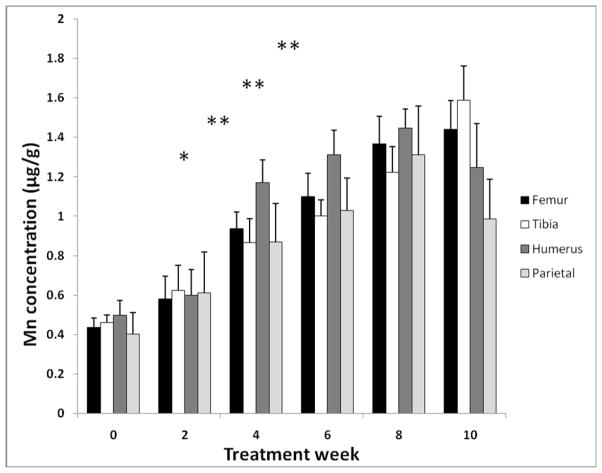
Fig. 2.
Time-dependent accumulation of Mn in rat bones after chronic oral Mn exposure. The animal treatment regimen is described in the legend to Fig. 1.
Mn concentrations in various bone samples were determined by AAS. Data represent mean ± S.D., n = 5–6; *: p < 0.05, **: p < 0.01 indicating group comparisons made between samples collected at times after Mn exposure and samples at time 0.

