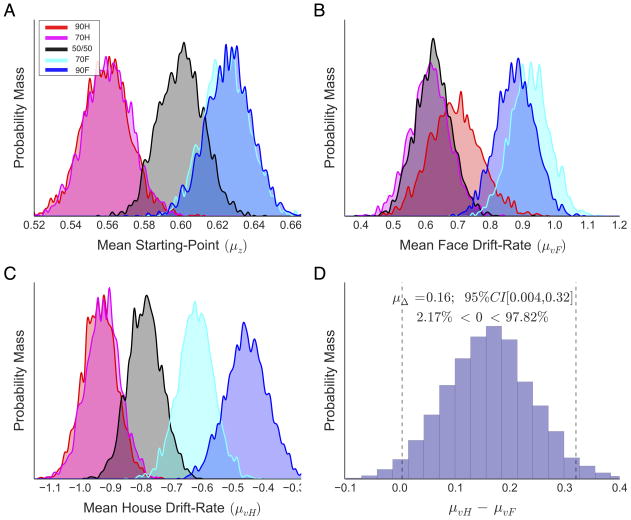
Figure 5. Mean starting-point and drift-rate posterior distributions from MSM across prior probability cues.
Distributions show the posterior probability of mean (A) starting-point, (B) face drift-rate, and (C) house drift-rate in each probabilistic cue condition. (D) Contrast of posterior face and house drift-rate estimates in the neutral cue (i.e., 50/50) condition, showing a significantly higher house than face drift-rate (vertical dotted lines show the 95% credible interval of the difference).

