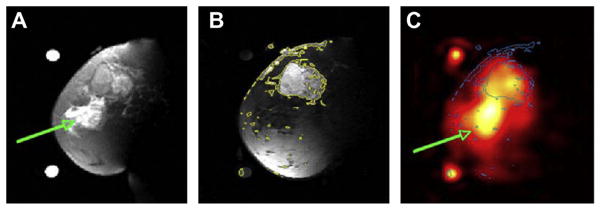
Fig. 13.

Examples of breast cancer images from a patient with 5.5 cm infiltrating poorly differentiated ductal carcinoma (T3) at the 12 o’clock position in the left breast. (A) Fat suppressed T2 weighted MRI showing a mass with T2 intermediate signal and edematous T2 bright retroareolar glandular tissue (arrow). (B) Fat suppressed T1 weighted MRI post-Gd injection with contour levels in yellow, showing enhancement of the mass at 12 o’clock but not in the retroareolar glandular tissue. (C) Sodium MRI with contours from B superimposed in blue. The region with edema is indicated by the green arrow. Reproduced with permission from Ref. [168].
