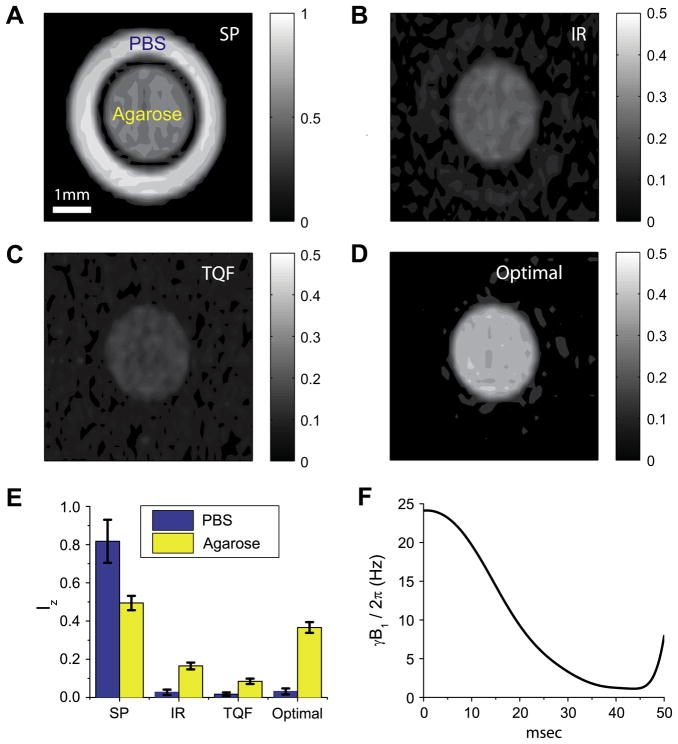
Fig. 6.
23Na images of a phantom consisting of an inner 3 mm tube filled with 20% agarose gel (T1,slow = 31.5 ms, T1,fast = 30.3 ms, T2,slow = 28.5 ms, and T2,fast = 3.1 ms) and an outer 5 mm tube filled with PBS (T1 = T2 = 56.4 ms). The images were recorded by using (A) a hard 90° pulse, (B) inversion recovery with a delay of 35.5 ms, (C) spin-echo TQF, and (D) an optimal pulse. The intensities were scaled with respect to the pixel of the highest intensity from the image (A). (E) Comparison of averaged intensities of PBS and agarose gel in the images (A–D). (F) The waveform of the optimal pulse used to get the image (D). Parts of the figures are reproduced with permission from Ref. [60].

