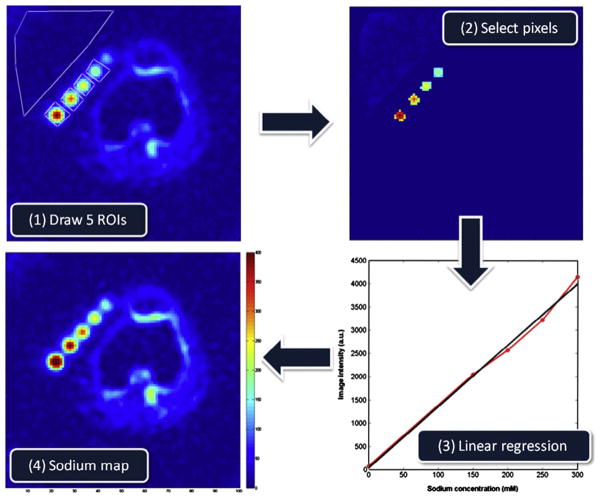
Fig. 8.
Example of a tissue sodium map (TSC) calculation in articular cartilage. (A) ROIs are drawn over the noise background (which serve as the 0 mM sodium concentration reference) and over reference phantoms (here, 150, 200, 250 and 300 mM). (B) The same number of voxels with higher signal intensity is selected from each ROI on each phantom, and all voxels from the noise background are selected. (C) The mean signal intensity is calculated for the noise and for each phantom, and plotted versus their known sodium concentrations. Simple linear regression is then performed for fitting the points with a function I = a × TSC + b, with I the image intensity, and TSC the tissue sodium concentration of the phantoms (in mM), a and b the unknown constants to be found by regression. (D) The TSC map calculated by TSC = (I − b)/a.

