Figure 3.
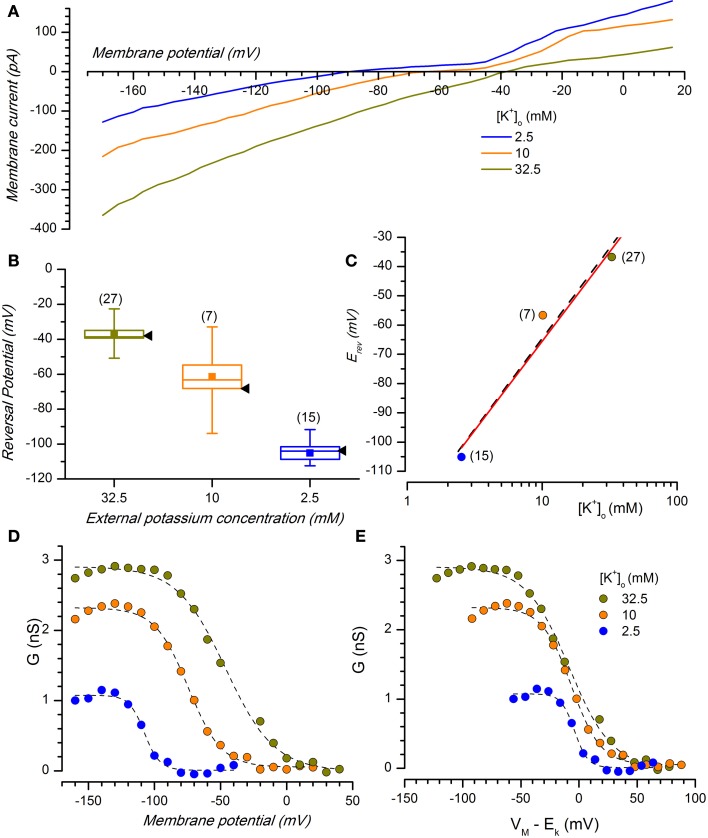
Potassium sensitivity. (A) Effect of changing [K+]o on membrane current. Average currents (n = 8) at the indicated external potassium concentrations in response to voltage ramps from −170 to +20 mV from a holding potential of −40 mV, 0.22 V/s; perforated patches; the bathing solution included Bl1 and Bl2. (B) Box charts showing the reversal potentials at different [K+]o [same color code as in (A)]; black arrow heads to the right of each box mark the expected reversal potentials predicted by the Nernst equation. In the box charts, here and in the following, the square in the center of the box represents the mean value, the horizontal line crossing the box indicates the median, the range of the box represents standard error and the whiskers define the 10–90% range of data sample. (C) Plot of the reversal potential for the inwardly rectifying current against the logarithm of [K+]o. The linear regression fit (black dash line) has a slope of −61.9 mV, close to the theoretical value of −61 mV predicted by the Nernst equation (red line). (D) K+- and voltage-dependence of chord conductance (gKir); the chord conductance was calculated using the equation gKir = IKir/(Vm − EK), where IKir = steady state current. gKir plotted as a function of voltage-clamp test potentials at 2.5, 10, and 32.5 mM [K+]o. (E) Data in (D) replotted as a function of the driving force. Data points were fitted by Boltzmann curve using a least-squares method; n for 2.5, 10, and 32.5 mM was 7, 5, and 12, respectively.

