Figure 4.
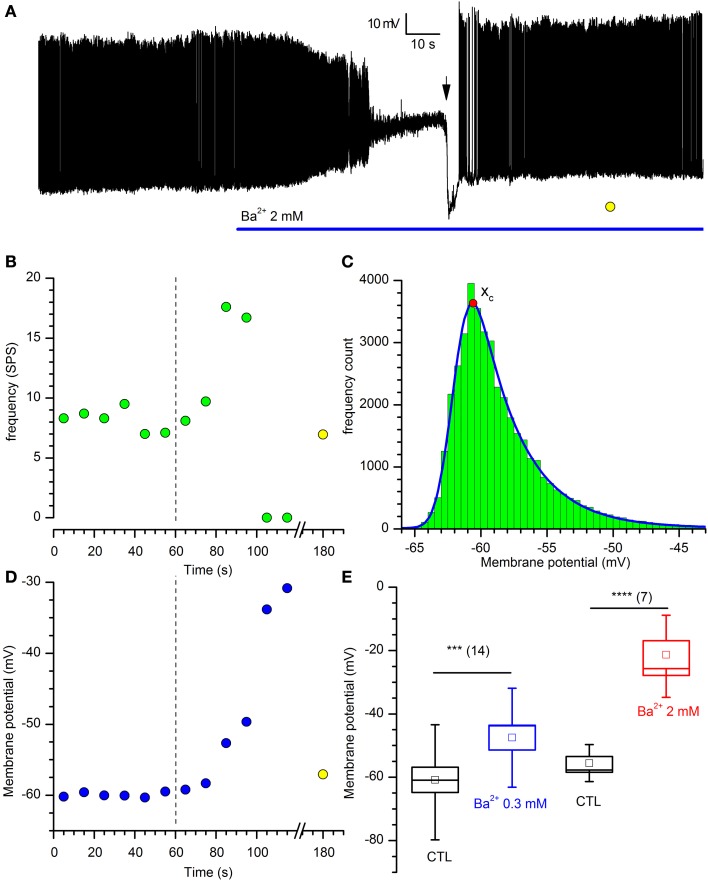
Effects of Barium on DA-PG cells. (A) Effect of Ba2+ on membrane potential. Perforated patch recording in standard saline (EC1 solution). The blue bar indicates the time of application of 2 mM Ba2+ into the bath; starting at the time indicated by the downward arrow, a 40 pA hyperpolarizing current was injected; (further explanation in the text). (B) Frequency analysis of action potentials (SPS, spike per second) for the experiment shown in panel A; the dashed line marks the time at which Ba2+ has been applied and the yellow point after the x-axis interruption is a measure of the activity after the injection of a hyperpolarizing current, at the time marked by a yellow point in (A). (C) Illustration of the method used for the calculation of the prevailing membrane potential (further explanation in the text): 10 s frequency count histograms of the membrane potential were realized at 10 s intervals, and the distributions were fitted by an exponentially modified Gaussian function (equation 3 in the text); the point marked by the red dot indicates the prevailing membrane potential (xc in equation 3). (D) Depolarization induced by 2 mM Ba2+ in the experiment shown in (A) using the analysis of the prevailing membrane potential (blue dots); the dashed line marks the time at which Ba2+ has been applied and the yellow point after the x-axis interruption is a measure of the membrane potential at the time marked by a yellow point in (A). (E) Depolarization induced by two different concentrations of [Ba2+]o: 13. 3 ± 2.2 mV for 300 μM (n = 14), and 38.1 ± 6.0 mV for 2 mM (n = 7).

