Figure 5.
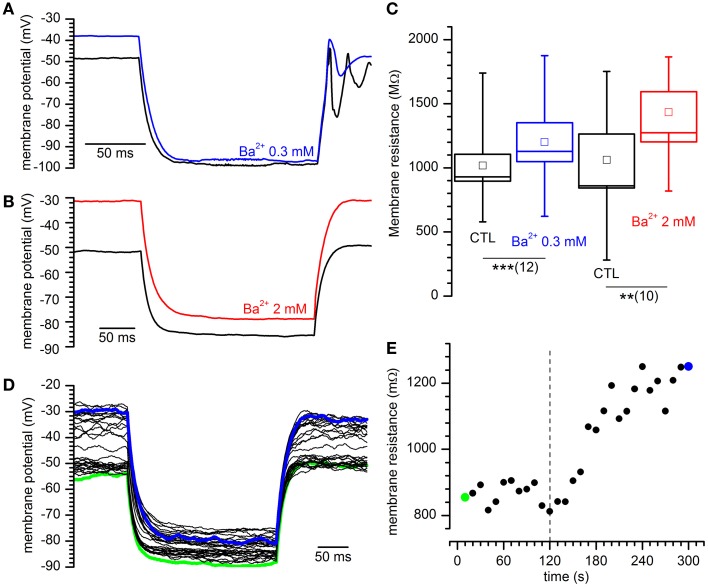
Effect of different concentrations of Ba2+ on input resistance. (A,B) Sample tracings showing the response to the injection of 40 pA in current-clamp conditions for the indicated external Ba2+ concentrations. (C) Increase of input resistance at the indicated external Ba2+ concentrations: +17.8 ± 3.2%, n = 12, and 58.7 ± 14.2%, n = 10 in 0.3 and 2 mM external [Ba2+]o with respect to controls. ** and *** indicate significance levels of 0.01 and 0.001, respectively. (D) Family of tracings obtained in response to hyperpolarizing current pulses as indicated in (A); green and blue traces are taken at the beginning and at the end of a 5′ test; Ba2+ was applied after 2′. (E) Time course of the variation of input resistance for the experiment shown in (D); the dashed line marks the time of application of Ba2+ 2 mM; green and blue dots mark the resistance of the traces with the same color in (D).

