Figure 8.
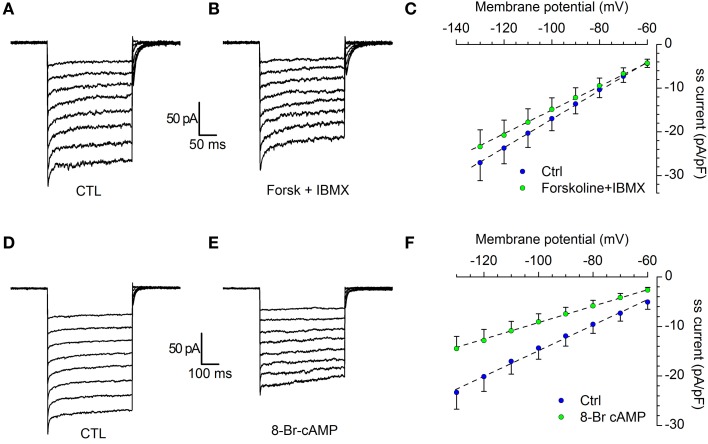
Modulation of IKir by cAMP. (A–C) Effect of forskolin. Current tracings in control (A) and in the presence of 10 μM forskolin plus 100 μM IBMX (B); (C) comparison of the I/V curves recorded in control (blue dots) and forskolin (green dots); n = 12; the difference, tested with Two-Way ANOVA and post-hoc Bonferroni test, is significant for the potentials more negative than −80 mV. (D–F) Effect of 8Br-cAMP. Current tracings in control (D) and in the presence of 10 μM 8Br-cAMP (E); (F) Comparison of the I/V curves recorded in control (blue dots) and 8Br-cAMP (green dots); n = 6; the difference, tested with Two-Way ANOVA and post-hoc Bonferroni test, is significant for the potentials more negative than −80 mV. All recordings were realized in EC2 with the addition of BL1 and BL2, at 34°C.

