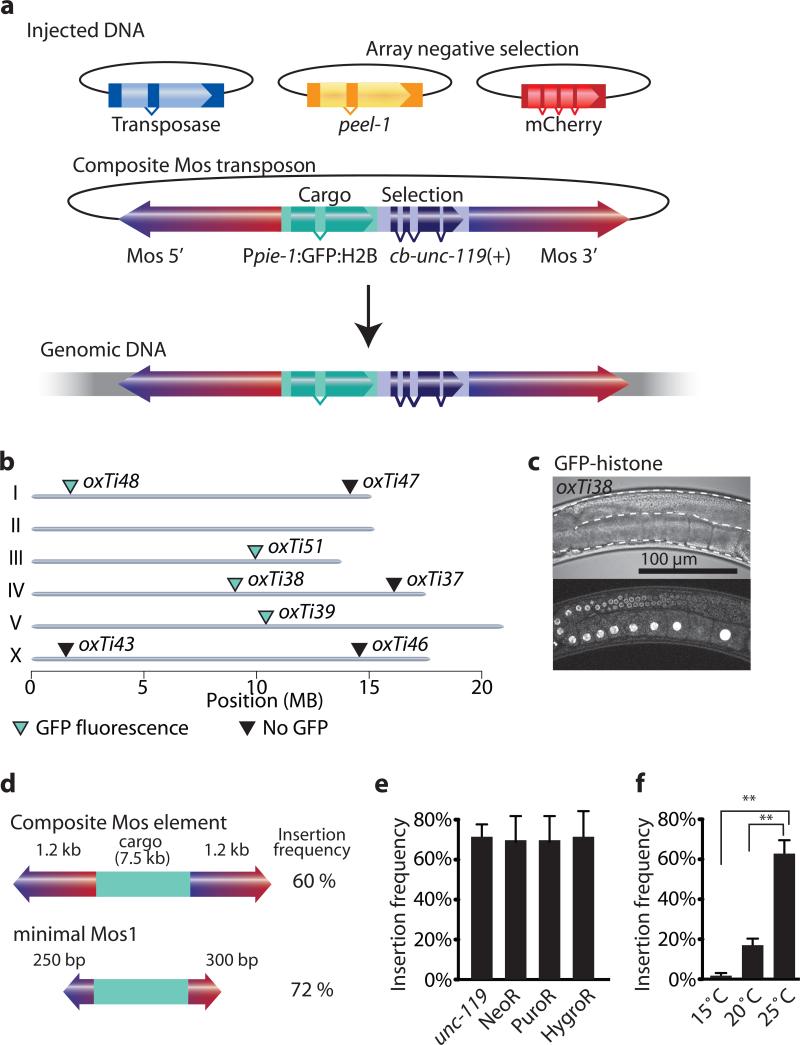
Figure 1. A modified Mos1 transposon can carry cargo.
(a) Schematic of recombinant Mosl insertion protocol. Transposon DNA is co-injected with a helper plasmid expressing the transposase (Peft-3:Mos1 transposase). Negative selection markers (Phsp16.41:peel-1, Pmyo-2:mCherry, Prab-3:mCherry and Pmyo-3:mCherry) were used to select against array-bearing transgenic animals. (b) Genomic locations of insertions identified by cb-unc-119(+) rescue of unc-119 mutants. All insertions rescued unc-119, but not all strains expressed GFP-histone in the germline. Germline fluorescence is indicated with turquoise (GFP-positive) or black (no fluorescence) triangles. (c) Fluorescence image of germline expression. Transposon insertion oxTi38 expressed GFP-histone in the germline (Ppie-1:GFP:H2B). Above, differential interference contrast; below confocal fluorescence image. Scale bar = 100 μm. (d) Schematic of the minimal Mos1 transposon (miniMos). 550 bp was enough to retain full insertion frequency. (e) Bar-graph of insertion frequencies with the genetic marker unc-119(+) and antibiotic selection markers G418 (NeoR), puromycin (PuroR) or hygromycin B (HygroR). Values show the average of two independent injections and error bars show the 95% confidence interval (modified Wald method). (f) Bar-graph of insertion frequency at different temperatures. Values shown are averages of three independent replicates (injections) and error bars represent standard error of mean (SEM). Statistics: repeated measures ANOVA (P = 0.0017). Bonferroni post-hoc comparison. **, P < 0.01.

