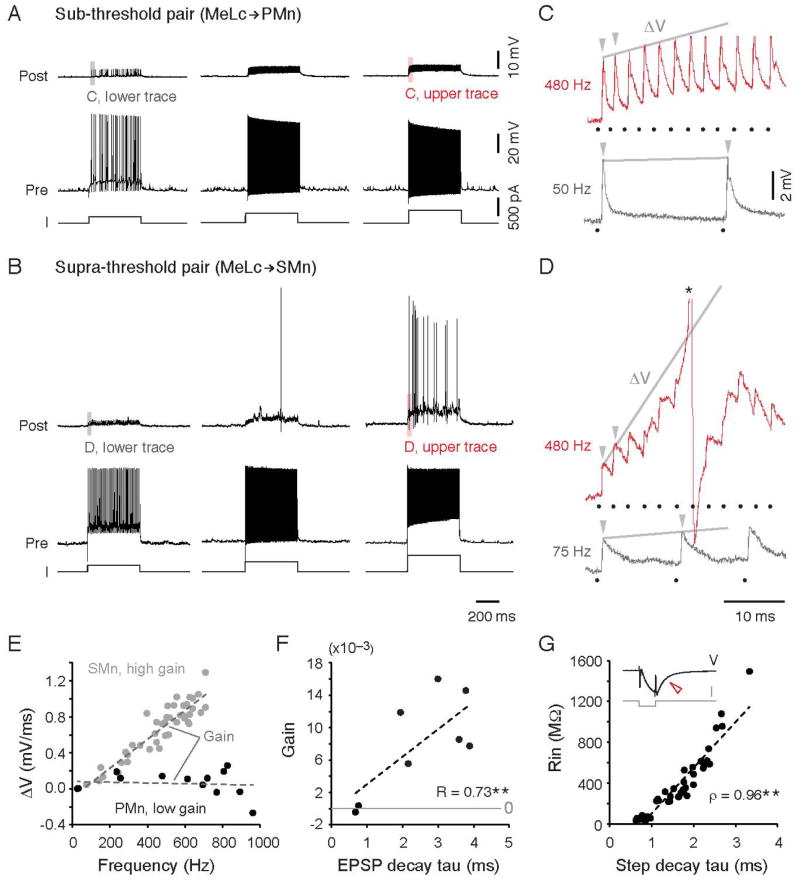
Figure 4. Temporal Summation Enables Higher Rin Motoneurons to Fire.
(A) Steps of increasing current levels (I) from left to right lead to increases in instantaneous spike frequency in the MeLc (left, 50 Hz; middle, 255 Hz; right, 480 Hz). MeLc action potentials elicit reliable EPSPs in the connected PMn (Rin = 56 MΩ), which never fires action potentials.
(B) As in A, but for a more excitable SMn (Rin = 404 MΩ). Increases in the instantaneous spike frequency of the MeLc (left, 75 Hz; middle, 260 Hz; right, 480 Hz) are sufficient to get the SMn to fire action potentials.
(C) Expanded view of EPSPs evoked by the first two spikes in the current step from the gray (low MeLc firing frequency) and red (high frequency) shaded areas in A. The gray line connects the peaks of the first two EPSPs (arrowheads) and the resulting slope (ΔV) was used to calculate EPSP summation at different MeLc firing frequencies. Here, and elsewhere black dots mark the timing of corresponding MeLc action potentials. C and D share the same scale bars.
(D) As in C, but for the SMn illustrated in B. Note the much larger ΔV in the top red trace compared to the PMn in C at the same MeLc firing frequency. The action potential is truncated (*).
(E) The slope (ΔV) of the first two MeLc elicited EPSPs versus the firing frequency of the corresponding MeLc action potentials for the PMn and SMn shown in A–D. The slope of the linearly fit trend lines was used as the gain for EPSP summation for each motoneuron (PMn, R = 0.1; SMn, R = 0.92).
(F) Gain of EPSP summation (the slope of the ΔV trend line as shown in E) versus EPSP decay time constant. **: p<0.05 following Pearson linear correlation test (R).
(G) Rin versus membrane time constant of spinal motoneurons. The repolarization of the membrane potential (V) after a brief hyperpolarizing current (I) pulse (open red arrowhead) was fit with a single exponential equation to calculate the membrane time constant. Trend line is a linear fit. **: p<0.05 following Spearman’s rank test (ρ).

