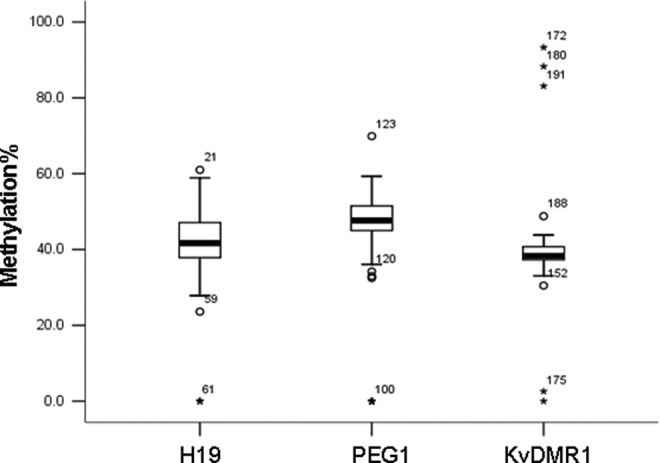
Figure 1.

Box plot analysis showed the distribution of methylation values of 3 differentially methylated regions (DMRs) in human embryo samples. Bottom of the box indicates the 25th percentile and the top indicates the 75th percentile. Outliers, which were considered as aberrant methylation values, are shown as asterisk (for H19 DMR: embryo No. 47, 52, 59, 60, 61; for PEG1 DMR: embryo No. 64, 100, 104, 119, 120, 122, 123, 124, 126, 127, 128; for KvDMR1: embryo No. 152, 172, 175, 180, 188, 191, 194).
