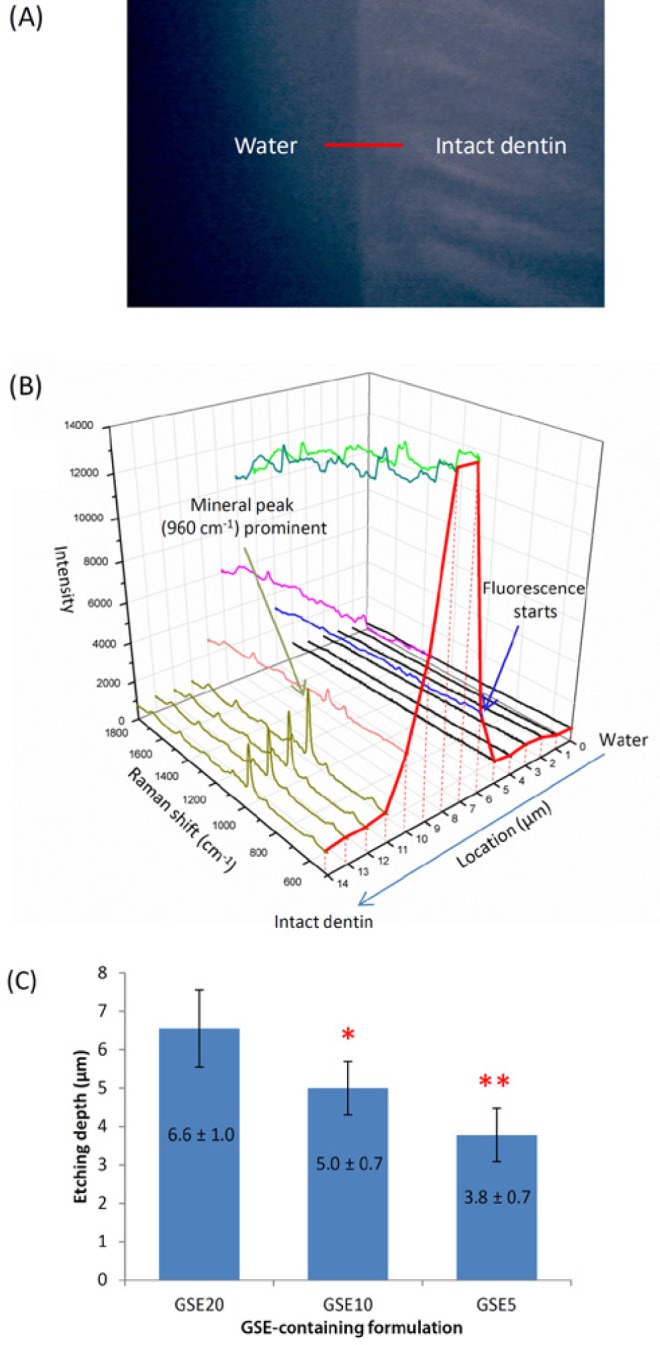
Figure 2.

Etching depth as determined by micro-Raman spectroscopy. (A) Optical image of the fractured cross section of a representative specimen etched by GSE10 for 30 sec. (B) Raman spectra collected from this specimen. Note the change of baseline intensity (red curve) with respect to location. At 6 µm, the abrupt rise in baseline indicates the start of fluorescence (blue arrow) and, therefore, the water–demineralized dentin interface. At 11 µm, the spectrum shows prominent mineral peak (dark green arrow), indicating the demineralized dentin–intact dentin interface. (C) Thirty-second etching depth of GSE20, GSE10, and GSE5. Statistical analysis was performed with SPSS 21 and nominal level of significance set at 0.05. The normality of distribution and homogeneity of variances were confirmed with Shapiro-Wilk and Levene tests, respectively. Comparison of means was performed with 1-way analysis of variance and Tukey post hoc test. Statistically different values are indicated by asterisks (* and **) (n = 6). GSE, grape seed extract.
