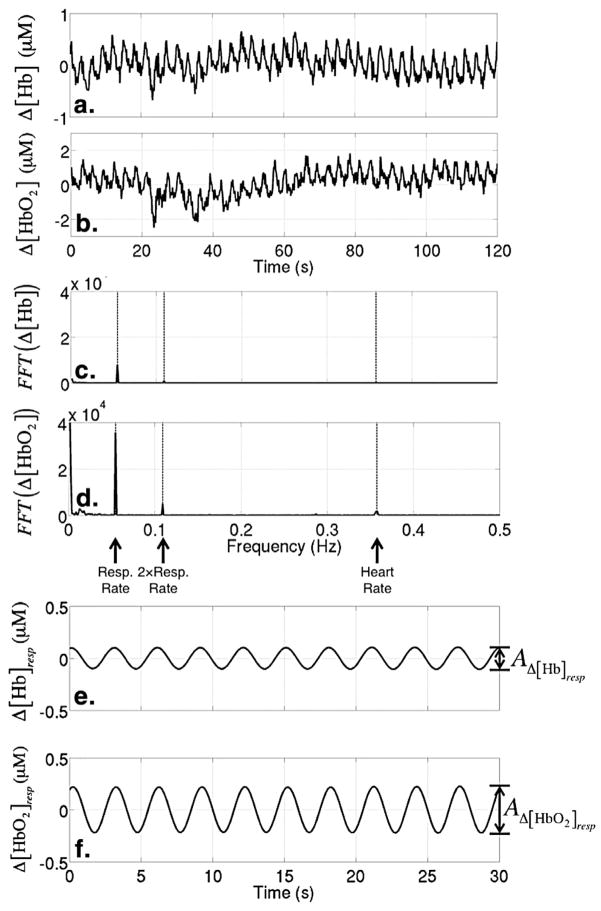
Figure 2.
Sample time series of differential (Δ) oxyhemoglobin (Δ[Hb]) (a) and deoxyhemoglobin ([ΔHbO2]) (b). Fast Fourier transform (FFT) of the Δ[Hb] time series (c) and the Δ[HbO2] time series (d). The dashed lines indicate the respiration rate, the second harmonic of the respiration rate, and the heart rate. The bottom two plots show sample time series of Δ[Hb] (e) and Δ[HbO2] (f) after bandpass filtering at the respiration rate/frequency.

