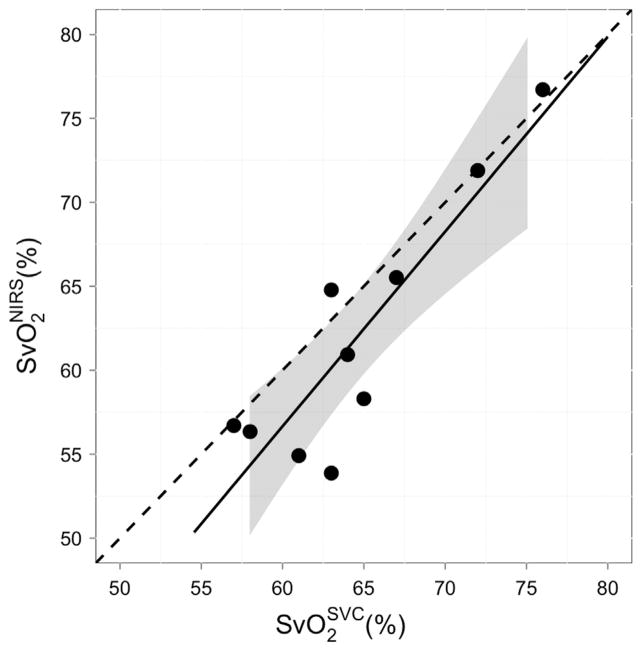
Figure 4.
Cerebral venous saturation measured with near-infrared spectroscopy compared to venous saturation measured from a blood sample invasively taken from the super vena cava (SVC). The solid line represents the best-fit line to the data (R2 = 0.80, P < .001); the dashed line indicates the line of perfect concordance; and the gray ribbon denotes the 95% confidence interval for the mean venous saturation (SvO2) measured noninvasively with near-infrared spectroscopy.

