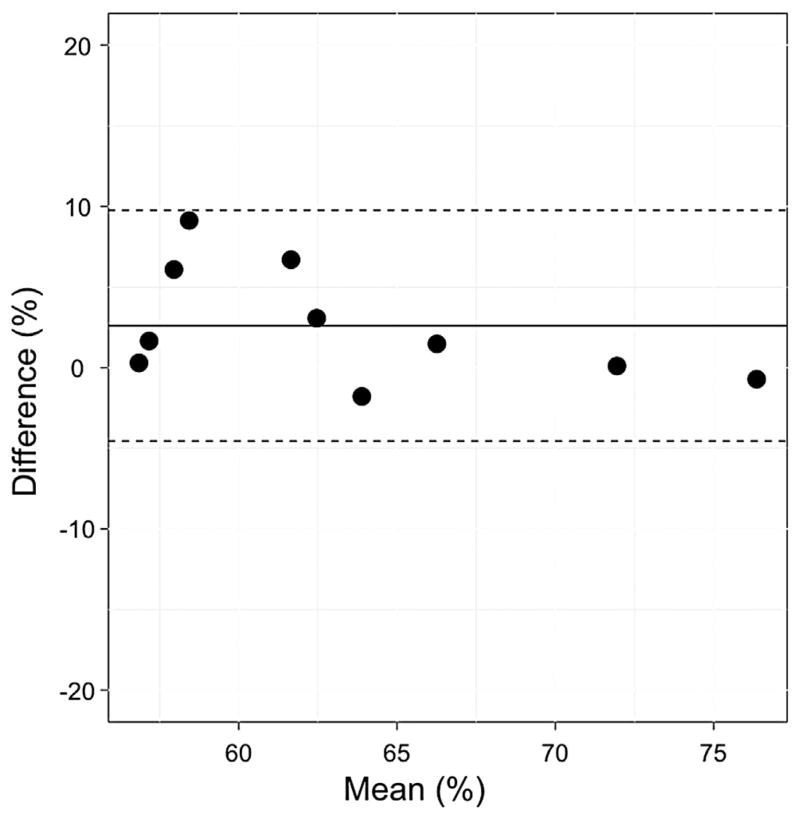
Figure 5.
Bland-Altman plot of the difference in and versus the mean of these two parameters. The solid horizontal line indicates the mean difference between these two parameters; the dotted lines indicate the 95% limits of agreement. , venous saturation measured noninvasively with near-infrared spectroscopy; , venous saturation measured from a blood sample from the superior vena cava.

