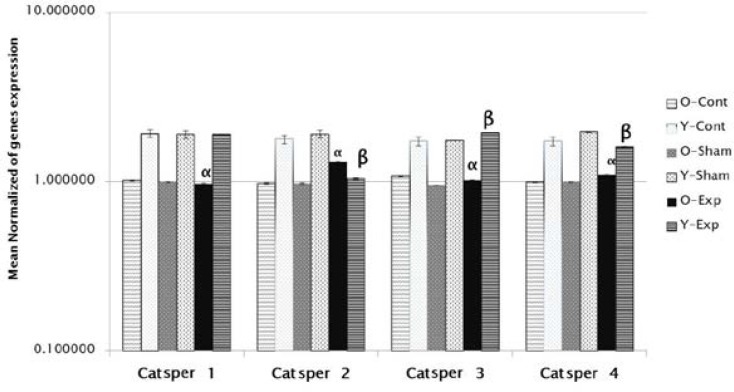
Figure 2.
Mean normalized of gene expression indicated that the expression of Catsper 2, 4 was significantly enhanced in the aging experimental group compared with aging control group (p<0.05).
α: Statistical significancy with aging control p<0.05
β: Statistical significancy with Young control group p<0.05.
O-cont: old (aging) control group
Y-cont: (young control group)
O-Sham: old (aging sham group)
Y-Sham: (young sham group)
O-Exp: aging experimental group
Y-Exp: young experimental group

