. 2014 Aug 11;3:e03406. doi: 10.7554/eLife.03406

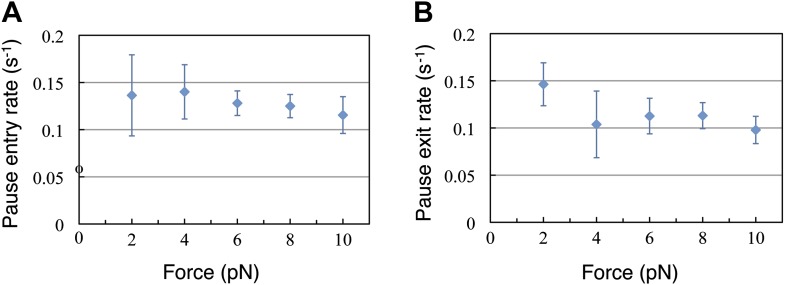
Figure 4. Pause entry and exit rates.

(A) Pause entry rate, calculated as the inverse of the mean duration of the translation bursts in between the pauses. (B) Pause exit rate, equal to the inverse of the mean pause duration. Both rates are essentially independent of the applied opposing force.

DOI: http://dx.doi.org/10.7554/eLife.03406.007

Figure 4.

Figure 4—figure supplement 1. Distribution of the translation bursts and pauses durations for all the measured opposing forces.

Figure 4—figure supplement 1.

Left panels: distribution of the bursts durations measured at the forces specified in each graph. Right panels: distributions of the pauses durations. With the exception of the pause duration distribution at 2 pN, for which the amount of data is limited (N = 6), all the distributions are well fitted by a single exponential function. The rates calculated from the distributions (k1, k−1) are indicated together with their 95% confidence interval. These rates are in good agreement with the rates calculated from the mean burst and mean pause durations (Figure 4).