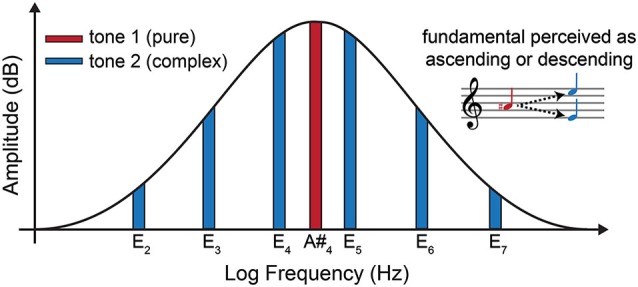
Figure 1.

Frequency spectrum diagram of the first (pure) tone (red) and the second (Shepard) tone (blue) of the bistable tritone stimulus employed in the current experiment. The horizontal axis is logarithmic reflecting perceptual as opposed to physical distances between frequencies. The musical staff (upper right) shows the two possible perceived pitch movements from tone 1 to tone 2. Due to the pitch ambiguity of tone 2, listeners perceive this pitch as either E4 or E5, which results in ascending or descending pitch percepts relative to tone 1.
