Figure 3.

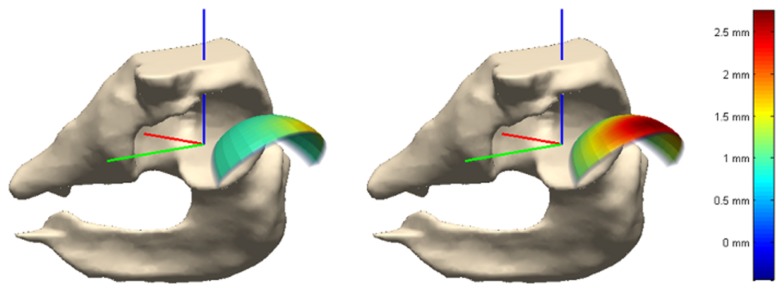
Cartilage thickness map on weight-bearing area in normal (left) and dysplastic (right) populations. The weight-bearing area is moved out of the joint for better visualization.

Cartilage thickness map on weight-bearing area in normal (left) and dysplastic (right) populations. The weight-bearing area is moved out of the joint for better visualization.