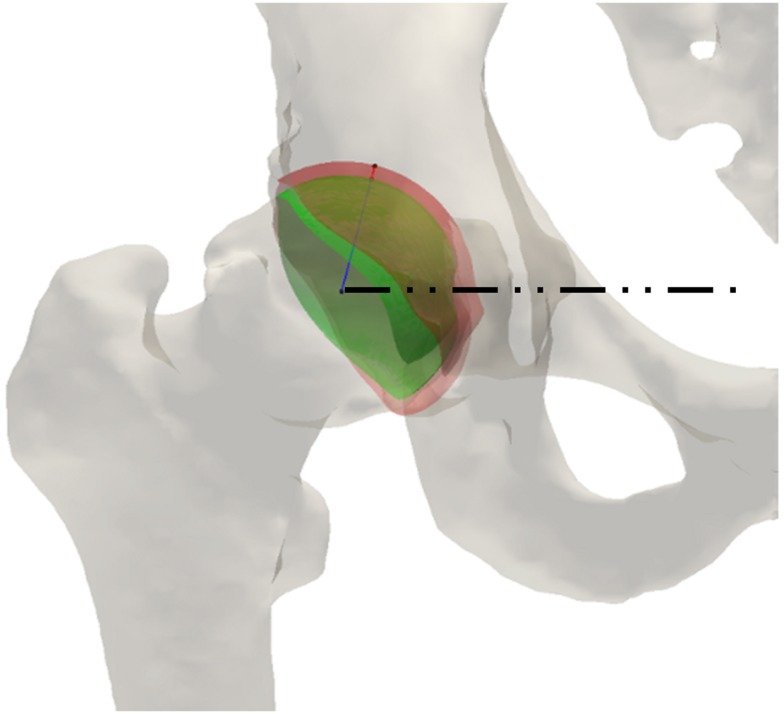
Figure 4.
Ray-firing method for indirect computation of cartilage thickness from CT data using bony surfaces. The green and red surface models represent the contact surface on femoral and acetabular sides, respectively. The blue line shows the radial direction from the center of the femoral head to an arbitrary point on the femoral head surface. The red line delineates the radial distance between the femoral head and acetabulum contact surfaces. The dashed line is the medio-lateral axis of the hip, extending through the centers of the femoral heads.

