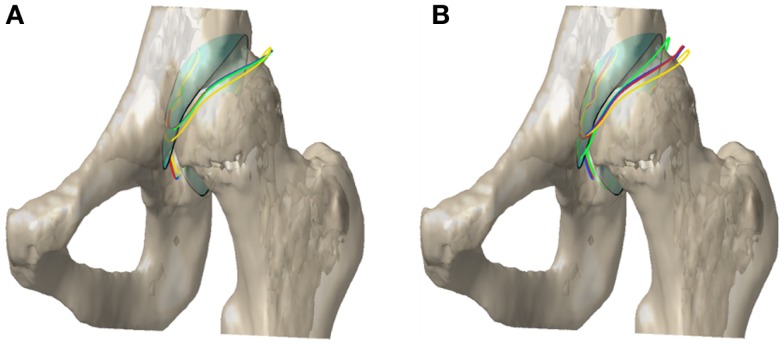
Figure 8.
Acetabular contact surface outline in the original and optimal alignment for (A) linear and (B) non-linear DEA. The colors red, blue, green, and yellow correspond to uniform, population-based (p-b) normal, p-b dysplastic, and CT-based cartilage thickness models, respectively. The cyan surface with the black outline represents the original alignment of the contact surface.

