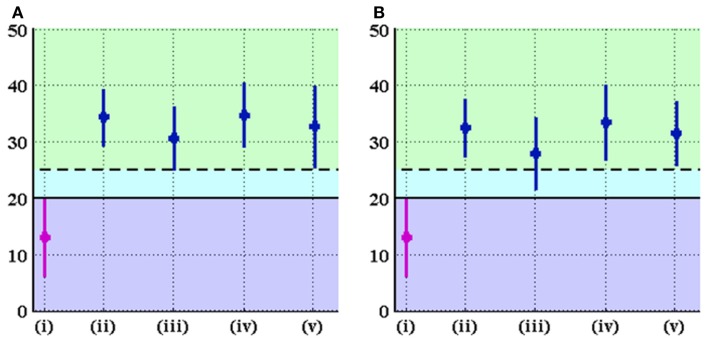
Figure 9.
CE angle (in degrees) in the original and optimal orientations of the acetabulum for (A) linear and (B) non-linear DEA. The graph displays mean ± standard deviation of measurements for each group. The groups denoted by (i), (ii), (iii), (iv), and (v) represent the original alignment and the optimal alignments found using uniform, p-b dysplastic, p-b normal, and CT-based cartilage thickness models, respectively. The solid line marks the border between the dysplastic and borderline values of the CE angle, while the dashed line represents the border between borderline and normal values of the CE angle. Optimal orientation of the acetabulum results in improvement (increase) of CE angle.

