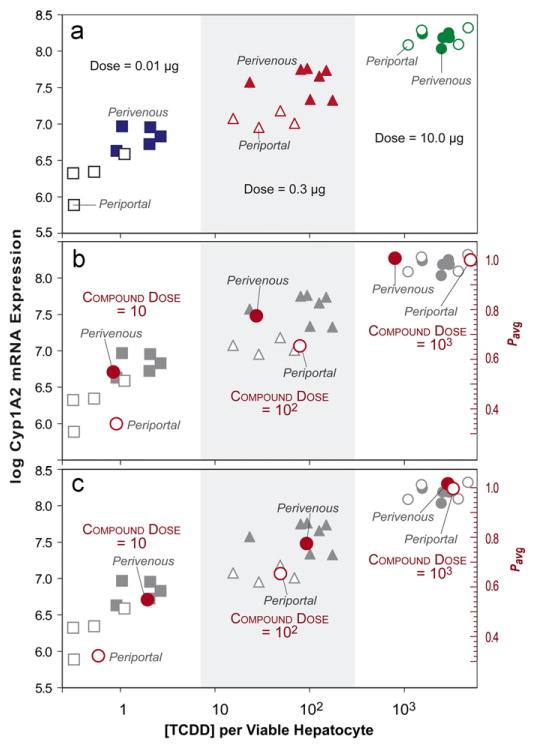
Fig. 10.

Wet-lab and ZoRLA data showing dose-dependent zonation. (a) Dose-dependent (x-axis) localization of [3H]TCDD (2,3,7,8-tetrachlorodibenzo-p-dioixon) and CYP1A2 mRNA expression (y-axis) in periportal and perivenous hepatocytes obtained from rats three days after a single oral dose of 0.01, 0.3, or 10.0 μg TCDD/kg; redrawn from Birnbaum et al. (1999). X-axis: levels of [3H]TCDD in the two-cell subpopulations expressed as attograms [3H]TCDD/viable hepatocyte; y-axis: log Cyp1A2 mRNA expression level. (b) The mean periportal and PERIVENOUS clearance effort values (pavg, right axis) from Fig. 9 are mapped to the wet-lab data using the transforms described in Results Section 3.4. The ZoRLA space was divided into two equal regions (zones) and the mean pi (pavg: right axis) along with mean compound elimination count within each region were calculated. The measurements were transformed to map quantitatively to the wet-lab data (both y- and x-axis placement) as described in Results. (c) The experiments that yielded Fig. 9 DOSE–response patterns were repeated using pBypass=0.99 rather than 0.8. pavg and mean compound elimination count were calculated as in (b). The measurements were transformed to map quantitatively to the wet-lab data as described in Results.
