
Fig. 3.
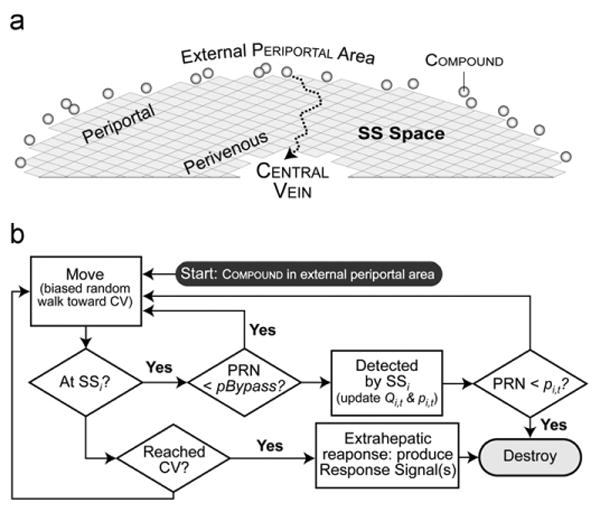
Events occurring within simulation cycle t. (a) Illustrated is a portion of a ZoRLA; SS agents (gray squares) are arranged into the illustrated 2D semi-circular grid pattern. The external periportal area maps to portal vein tracts. At the start of each simulation cycle, the compound dose is placed outside. Each compound enters at a randomly assigned SS on the outside edge. During each simulation cycle, compound move towards the CENTRAL VEIN (CV: the central, vacant region; it maps to both central vein and extrahepatic tissues) using the biased random walk described in Methods. The dotted arrow is an example of a compound'S path. When a compound (ka>0) reaches the CENTRAL VEIN it is removed, a response occurs, and r-signals are generated in proportion to ka. (b) The flowchart shows event logic from a compound'S perspective. During simulation cycle t, the clearance management module detects a collocated compound with probability=1–pBypass. Upon detection, it is cleared (removed) with probability pi,t. At the end of each simulation cycle, each SSi updates its Qi,t (to Qi,(t+1)) and clearance strategy – clearance effort – (pi,t) based on the number of compound cleared and the number of r-signals received. PRN: pseudo random number in [0,1].