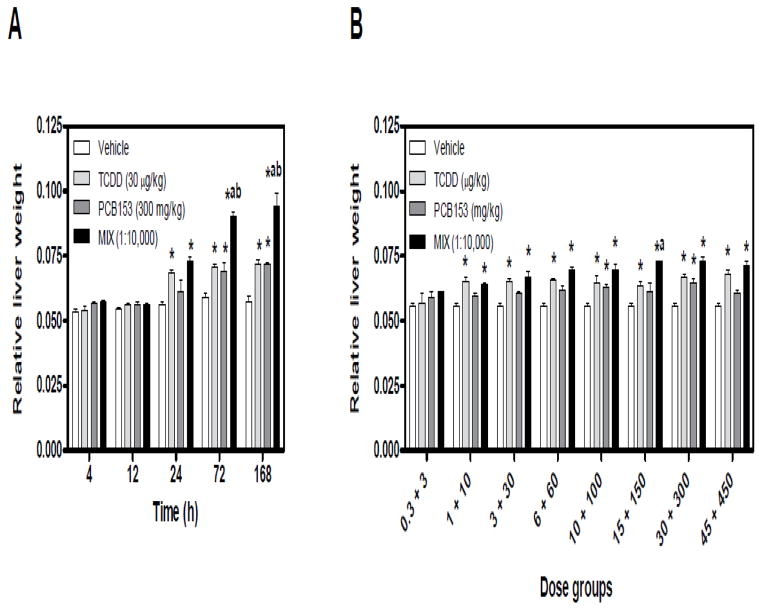
Figure 1.
Temporal and dose-dependent changes in the relative liver weight following exposure to TCDD, PCB153, and MIX. (A) In the time course study, 30 μg/kg TCDD + 300 mg/kg PCB153 were co-administered (MIX, 1:10,000 TCDD to PCB153). (B) In the 24 h dose-response, MIX (μg/kg TCDD + mg/kg PCB153) was administered at 1:10,000 ratio of TCDD to PCB153, respectively. Results are displayed as mean ± standard error (SE) for 5 independent replicates. Data were analyzed by analysis of variance (ANOVA) followed by Tukey’s post hoc test: *p<0.05 vs. vehicle, ap<0.05 vs. PCB153 and bp<0.05 vs. TCDD. Time course increases in relative liver weight induced by individual TCDD and PCB153 treatments are from Kopec et al. (2010b).

