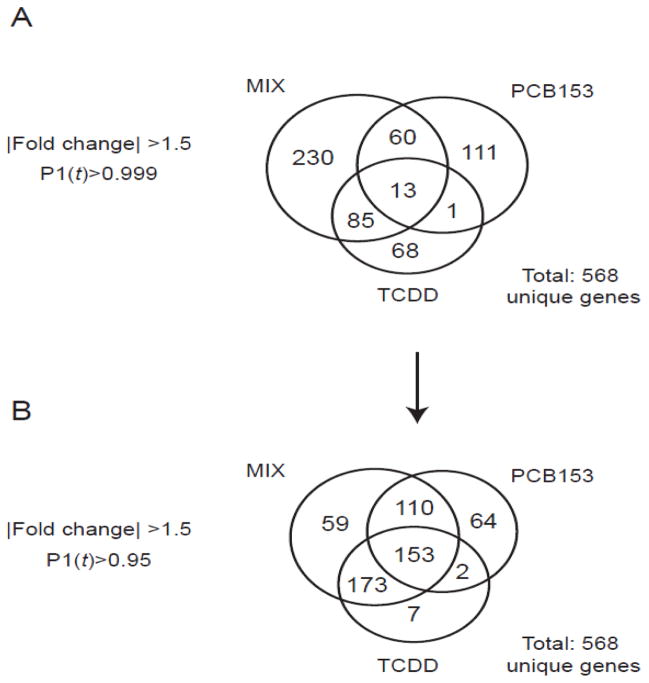
Figure 4.
Temporal microarray data sets for 30 μg/kg TCDD, 300 mg/kg PCB153 (Kopec et al. 2010b), and MIX (1:10,000 TCDD:PCB153) groups were compared using (A) stringent (|fold change|>1.5, P1(t)>0.999) and (B) relaxed (|fold change|>1.5, P1(t)>0.95) selection criteria. Numbers in the Venn diagram represent unique genes.

