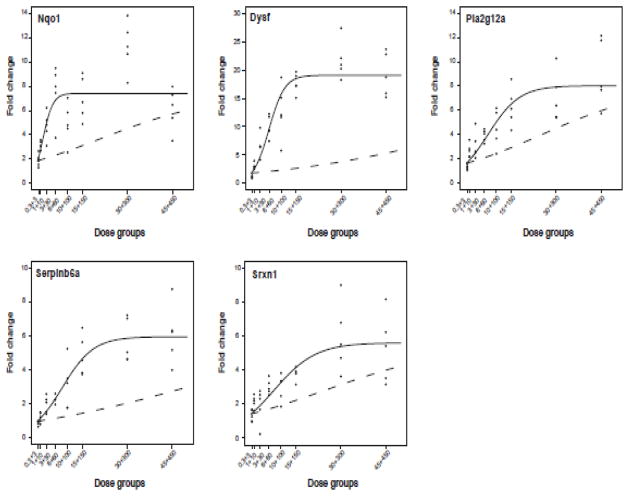
Figure 7.
Non-linear logistic modeling of QRTPCR dose-response data. Graphs depict the additive model (dashed line) generated using TCDD and PCB153 data and the mixture model (solid line) fitted using MIX data (black dots). MIX data for Nqo1, Dysf, Pla2g12a, Serpinb6a, and Srxn1 fit the mixture model better than the additivity model, indicating a statistically significant (p<0.0001) synergistic interaction.

