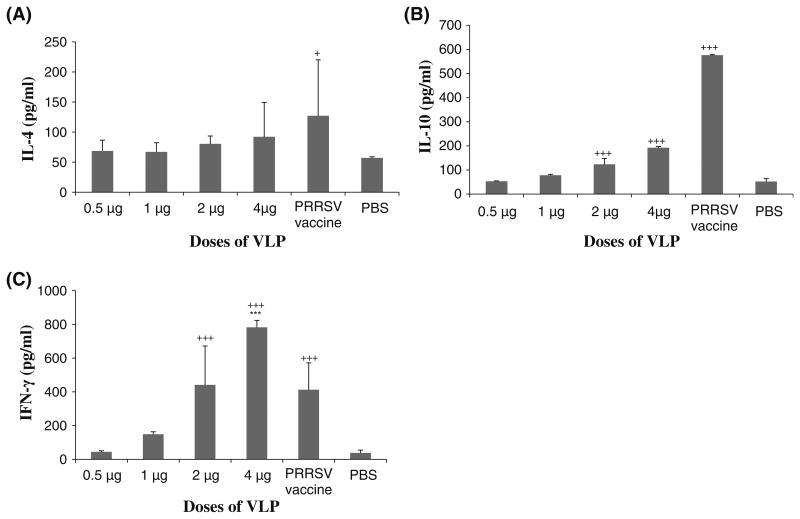
Fig. 4.
Cytokine expression profiles in splenocytes. Spleens were taken from VLP-vaccinated and positive and negative control mice at 2 weeks after the third vaccination. Splenocytes were prepared as single cell suspensions. The splenocytes were stimulated with the VLPs for 3 days. Cell culture supernatants were collected, and the amounts of IL-4, IL-10, and IFN-γ were determined by ELISA. a The amount of IL-4 produced in mice vaccinated with the commercial PRRSV vaccine was significantly higher at p<0.05 (+) than that of the PBS group. b The amounts of IL-10 produced from mice vaccinated with 2 and 4 μg of the VLP vaccine and the commercial PRRSV vaccine were significantly higher at p<0.001 (+ + +) than that of the PBS group. c The amounts of IFN-c produced from mice vaccinated with 2 and 4 μg of the VLP vaccine were significantly higher at p<0.001 (+ + +) than that of the PBS group. The amount of IFN-γ produced from mice vaccinated with 4 μg of the VLP vaccine was significantly higher at p<0.001 (***) than that of the commercial PRRSV vaccine group

