Figure 4.

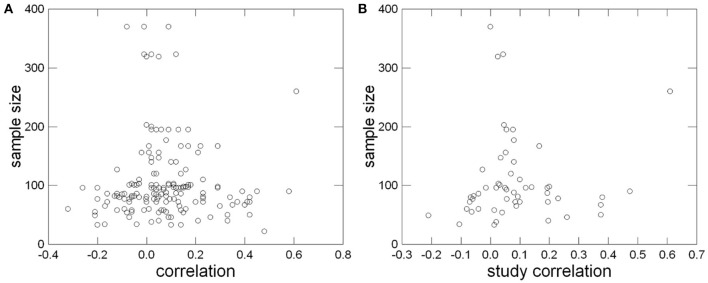
“Funnel-Plot” of single correlations (A) and of study correlations corrected for sampling error (B) for identification of a publication bias.

“Funnel-Plot” of single correlations (A) and of study correlations corrected for sampling error (B) for identification of a publication bias.