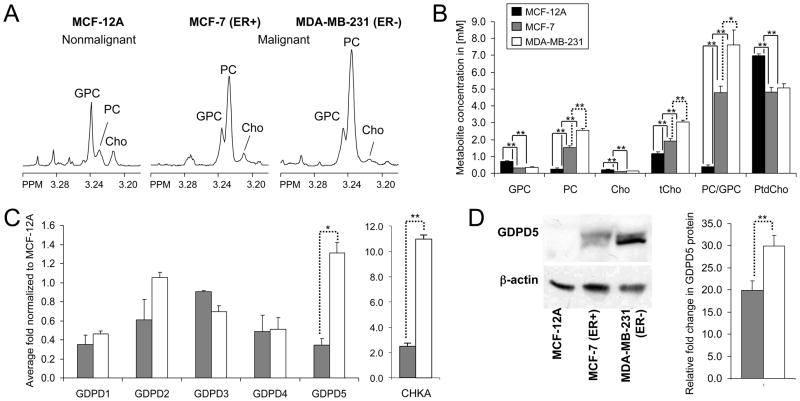
Figure 1.
A, representative 1H MR spectra of the choline region from hydrophilic extracts of MCF-12A, MCF-7, and MDA-MB-231 cells. B, metabolite concentrations in [mM] quantified from 1H MR spectra of MCF-12A (black bars), MCF-7 (gray bars), and MDA-MB-231 (white bars) cells. C, relative fold change in gene expression of GDPD1-5 and CHKA obtained from MCF-7 and MDA-MB-231 cells normalized to MCF-12A cells. D, representative GDPD5 immunoblots and relative fold change in GDPD5 protein levels normalized to MCF-12A cells. β-actin was used as loading control. Values are mean±standard error (SE). *P < 0.05, **P < 0.01.

