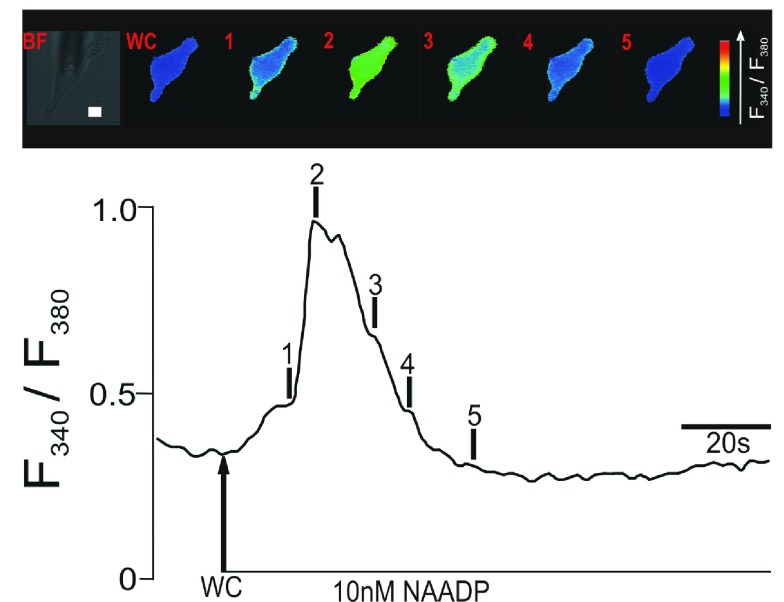
Figure 1.
Upper panel shows a series of pseudocolour images of the Fura-2 fluorescence ratio (F340/F380) recorded in an isolated pulmonary artery smooth muscle cell during intracellular dialysis of 10 nM NAADP. Note the spatially localized ‘Ca 2+ burst’ (time point 1). Lower panel shows the record of the Fura-2 fluorescence ratio against time corresponding to the upper panel of pseudocolours images; note the discrete shoulder in the rising phase of the F340/F380 ratio that corresponds to the initial ‘Ca 2+ burst’. Scale bar: 10 μm.

