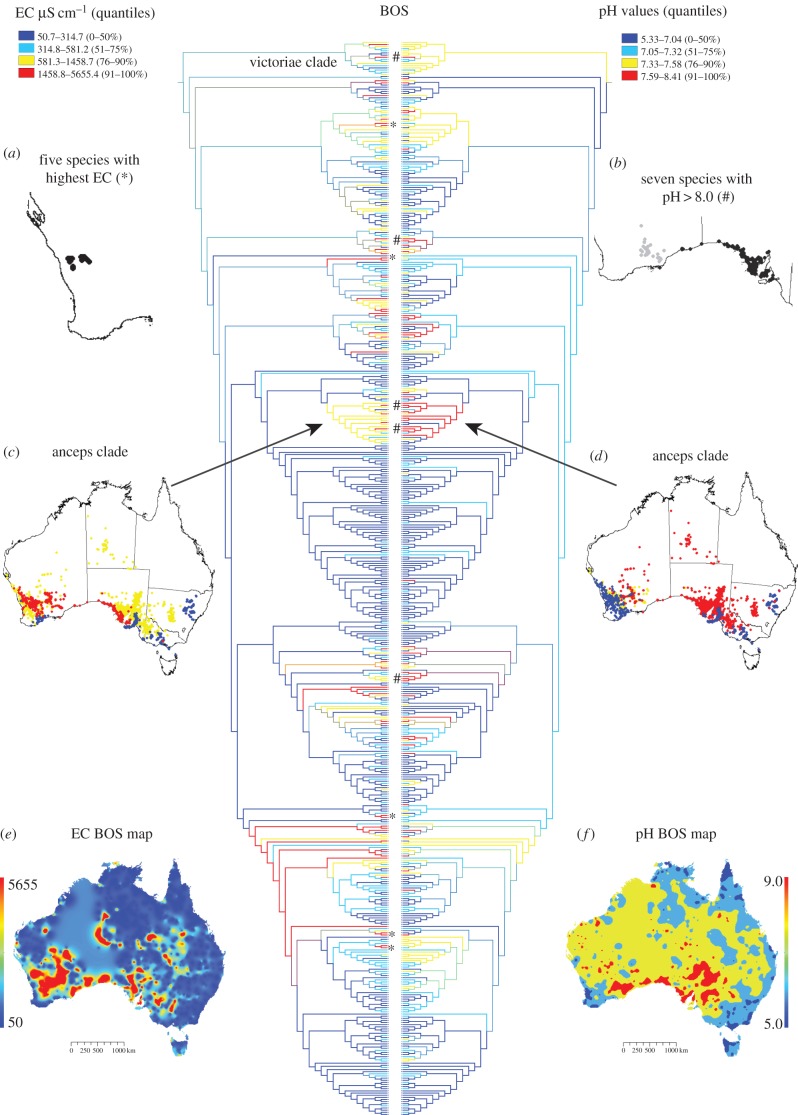
Figure 1.
Phylogenetic relationships of 503 Acacia species with EC_BOS (left) and pH_BOS (right); quantiles mapped and parsimony ancestral state reconstructed. Legend indicates raw values of quantiles. Asterisk (*) indicates species with highest EC_BOS values; symbol # indicates species with pH_BOS values more than 8.0. (a) Distribution map of the five species with highest average EC_BOS values; (b) Distribution map of A. dempsteri (grey), gillii, anceps and other species with subsoil pH > 8.0; (c) A. anceps clade with the species distribution coloured as on the EC phylogeny and (d) as on the pH phylogeny; (e) map of EC_BOS and (f) pH_BOS across Australia.

