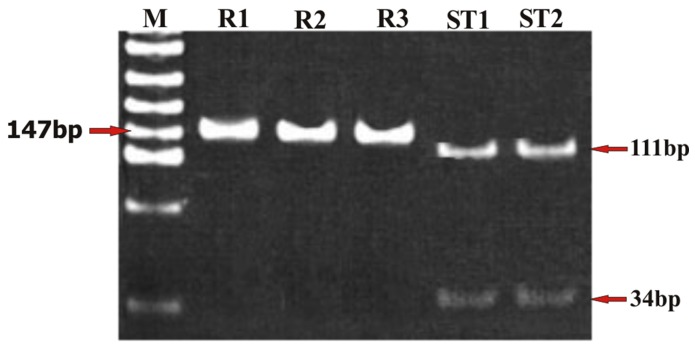
Figure 3. Representative photomicrograph showing the results of RFLP after digestion of PCR amplified product with endonuclease, Apo1 for Pcfrt gene (K76T) in chloroquine resistant and sensitive Plasmodium falciparum isolates.
In photograph, (M) is molecular weight marker pUC mix8; (R1-R3) are chloroquine resistant P. falciparum isolates and (ST1-ST2) are chloroquine sensitive P. falciparum isolates.

