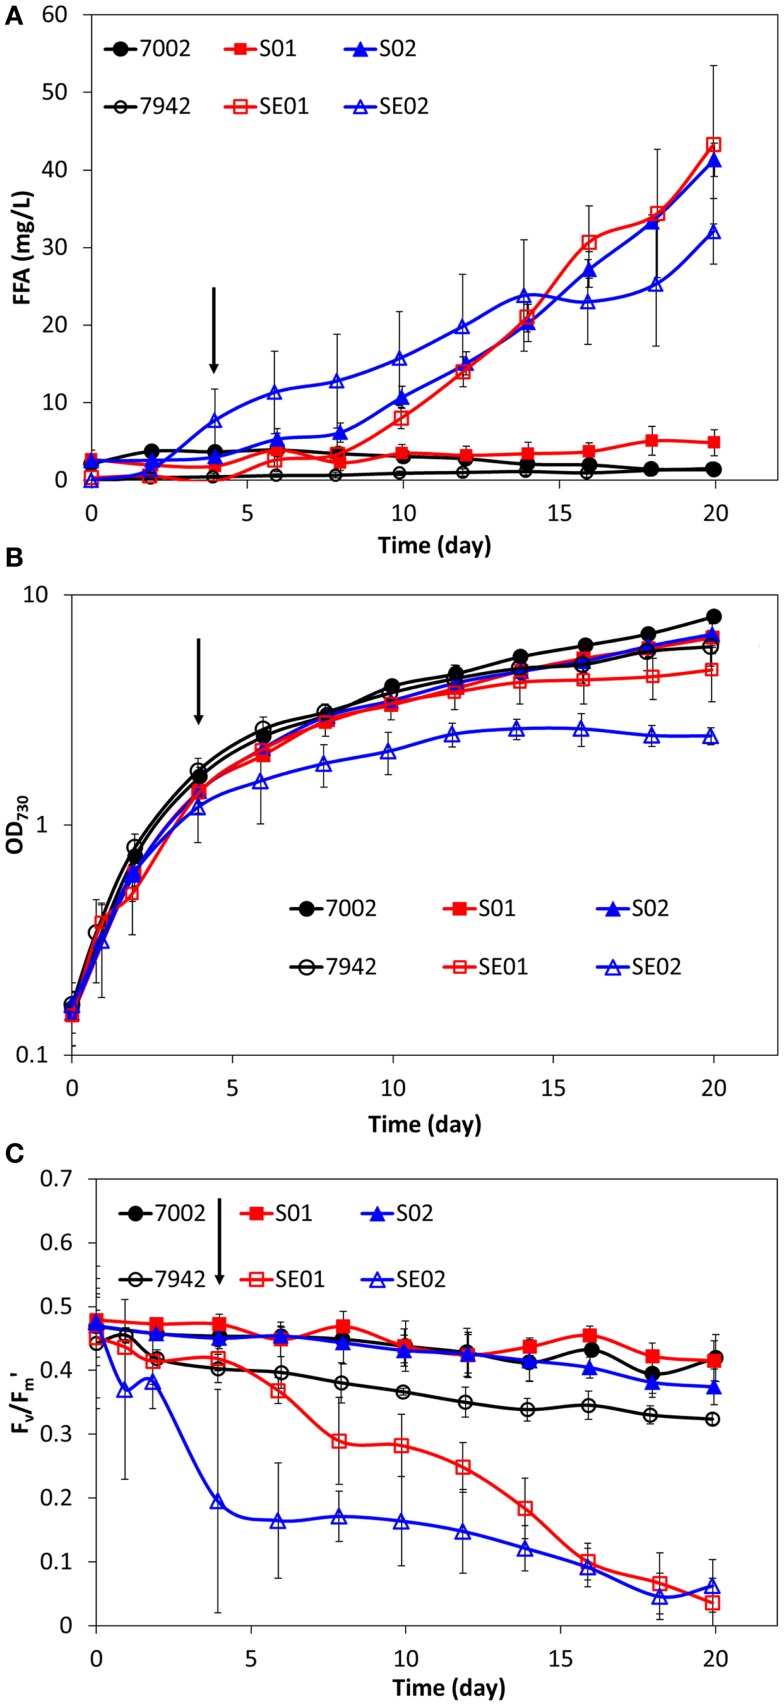
Figure 1.
Comparison of extracellular FFA concentration (A), cell concentration (B), and photosynthetic yields (C) during FFA production in two cyanobacterial hosts: S. elongatus PCC 7942 and Synechococcus sp. PCC 7002. Wild-type strains are illustrated with black circles (7942 – open, 7002 – filled). Strains with gene knockout of the FFA-recycling acyl-ACP synthetase/long-chain-fatty-acid CoA ligase (aas/fadD) are illustrated with red squares (SE01 – open, S01 – filled). Strains with gene knockout of the FFA-recycling gene and ‘tesA expression are illustrated with blue triangles (SE02 – open, S02 – filled). Addition of IPTG is indicated by the arrows (100 h). All data are averages of at least three biological replicates with error bars indicating the standard deviation.

