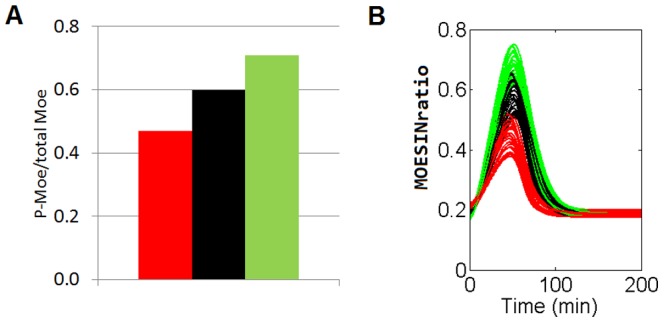
Figure 4. Model verification of the moesin role on the HIV-1 viral entry process.

Panel A shows the total amount of functional moesin on the peak of activated moesin (at 90 minutes after infection) as determined by Barrero-Villar et al. 2009 [10]. Panel B shows the result of the MOESINratio value obtained from the model by modifying the parameter rate K6 (related with the total amount of moesin). The red color refers to N-Moe (a dominant negative N-terminal fragment of the protein which impedes the physiological function of the intact moesin); the black refers to the control conditions and the green to the FL-Moe (an intact form of the protein which increases the total amount of moesin inside the lymphocyte).
