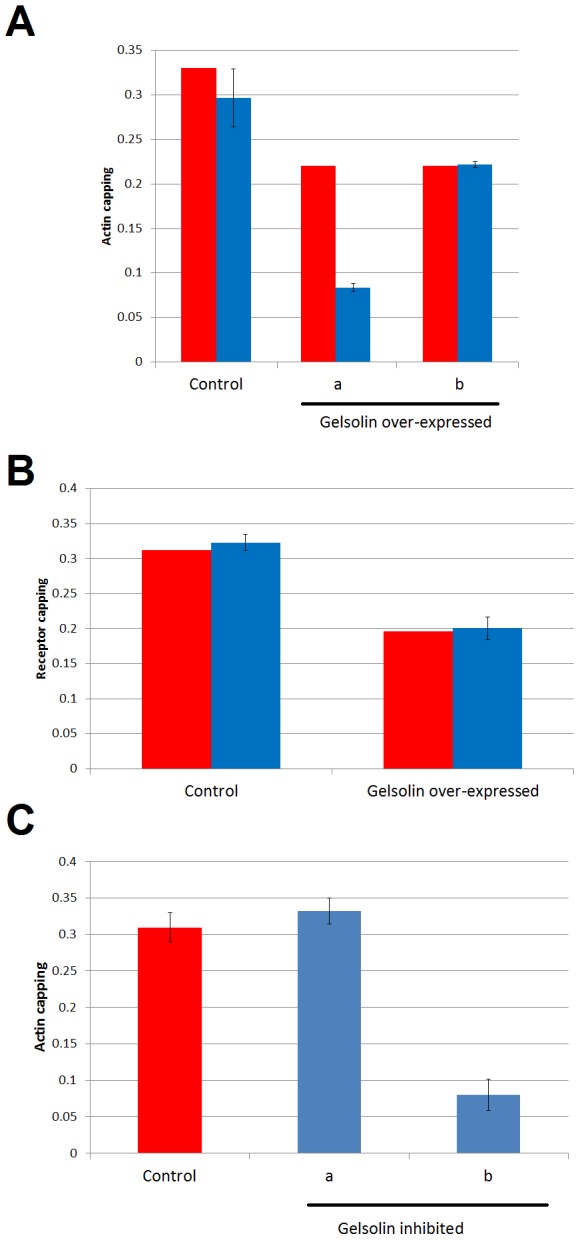
Figure 5. Comparison of the model predictions for two alternative roles of gelsolin in the cap formation.

Red bars represent the experimental measurements of actin capping in a control situation or after over-expressing gelsolin. Blue bars represent the model prediction with the standard deviation of all solutions selected (see Material and Methods). A. A set of scenarios is evaluated in the model assuming different actin capping influences of gelsolin. In “a” K7 was increased by 50%, assuming that gelsolin has a negative effect on actin capping. In “b”, K6 was increased to mimic a gelsolin activation on the actin capping by increasing the actin remodeling dynamics. B. Model verification of scenario “b” shown in panel A. The measured and the predicted maximum peak of the capping of receptors on the gelsolin over-expressed cell lines are shown. C. In “a” K6, the parameter that models gelsolin stimulation of actin capping, takes the value of 0.75 times the value in Control; in “b” this figure is 0.5 times.
