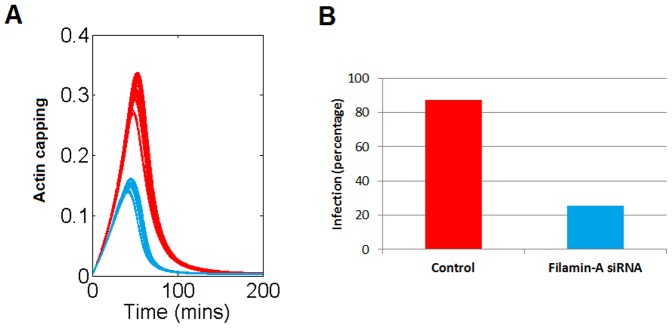
Figure 6. Model evaluation of the role of filamin on virus infectivity.

Red curves and bars refer to the control situation, while the blue ones represent the predicted response after a decrease in the total amount of filamin-A. A. Virus-induced actin aggregation time course. B. Virus infectivity in control and filamin down-regulated conditions according to Jiménez-Baranda et al. 2007 [15].
