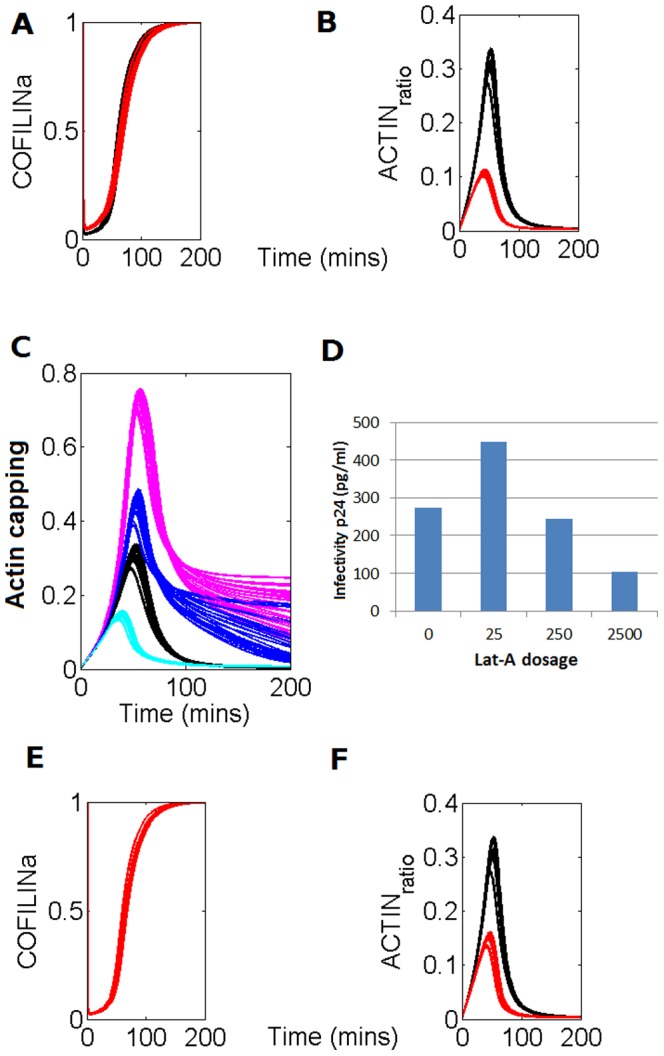
Figure 7. Model prediction and experimental verification of the LIMK1 signaling pathway knockdown and the actin polymerization inhibitor Lat-A on the virus infectivity.

A. Black line displays the original solution showed in Figure 1 while the red line represents the model prediction of the COFILINa variable after inhibition of the LIMK signaling pathway by a 50%. B. Black line displays the original solution showed in Figure 1; red line represents the model prediction of the ACTIN variable after inhibition of the LIMK signaling pathway by a 50%. C. The black lines (control condition where cofilin is active before infection) show the model's predicted dynamics of the actin capping. Pink lines show the solutions obtained when the initial state of cofilin, just before infection, was inactive. Dark blue lines represent the predicted dynamics of the actin capping after the activation of virus signaling on the cofilin. Light blue lines represent an increase of the intensity of the activation signaling of cofilin by the virus D. Experimental measurements of infectivity of the virus in increased initial concentrations of the actin-severing factor Lat-A (Yoder et al. 2008, [7]). E. Black line displays the original solution showed in Figure 1 while the red line represents the model prediction of the COFILINa variable after inhibition of the WAVE2 signaling pathway by a 50%. F. Black line displays the original solution showed in Figure 1; red line represents the model prediction of the ACTIN variable after inhibition of the WAVE2 signaling pathway by a 50%.
