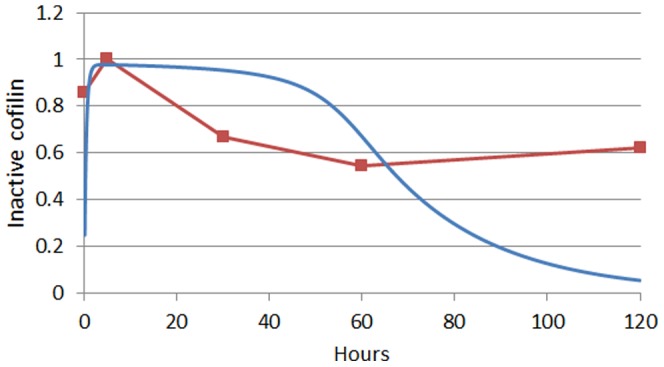
Figure 8. Model verification of the cofilin activity decay.

Red dots and line represent the dynamics of the active cofilin during the invasion of HIV-1 as determined by Yoder et al. 2008 [7]. These observations are compared with the predicted dynamics (blue line) of the same model variable (Cofa).
