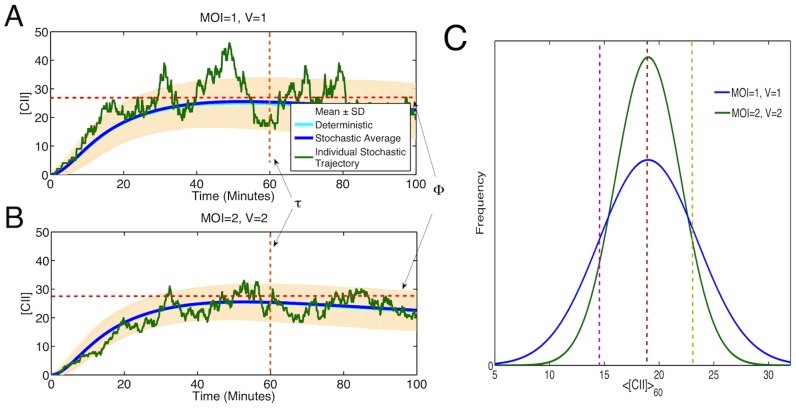
Figure 3. Average Stochastic Trajectories of [CII] over time interval  for stochastic non-spatial model.
Mean trajectories shown (blue line)  standard deviations (cream shaded region), alongside the deterministic trajectory (turquoise line). One stochastic trajectory from the data is also shown in green. (A) MOI = 1, V = 1 (
 ,
, ). (B) MOI = 2, V = 2 (
 ,
,  ). Results calculated based on
  simulations. (C) Distribution of
  showing a low threshold (purple dashed line), threshold at mean (brown dashed line) and high threshold (yellow dashed line). This illustrates that the area under the curve exceeding the threshold is larger for MOI = 2, V = 2 for the low threshold, equal areas for the threshold at the mean and larger area for MOI = 1, V = 1 for the high threshold.

