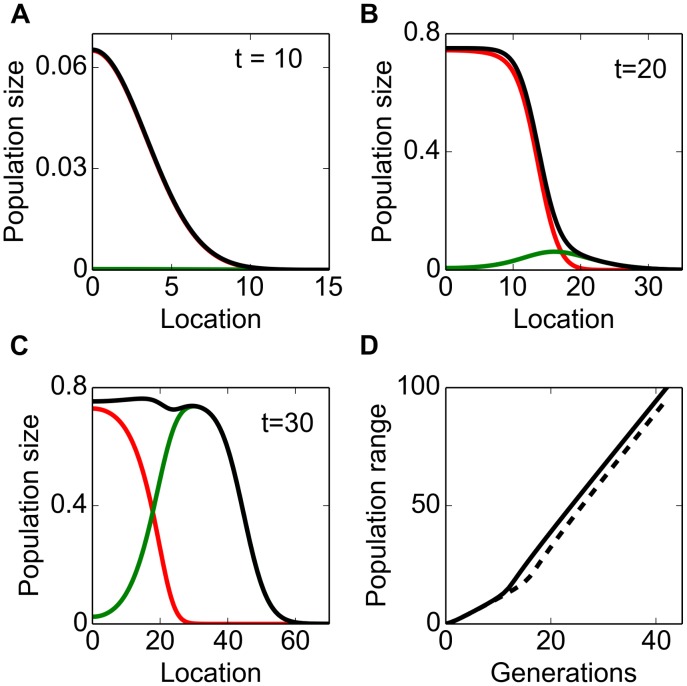
Figure 1. Spread of a population with two dispersal abilities.
Parameter values are  A–C: Population size at different time with the initial populations
  The colours red, green and black correspond to the type-1, type-2 and total population size respectively. D: A break of slope was observed in the population range. Initial propagules are
  (solid line) and
  (dashed line).

