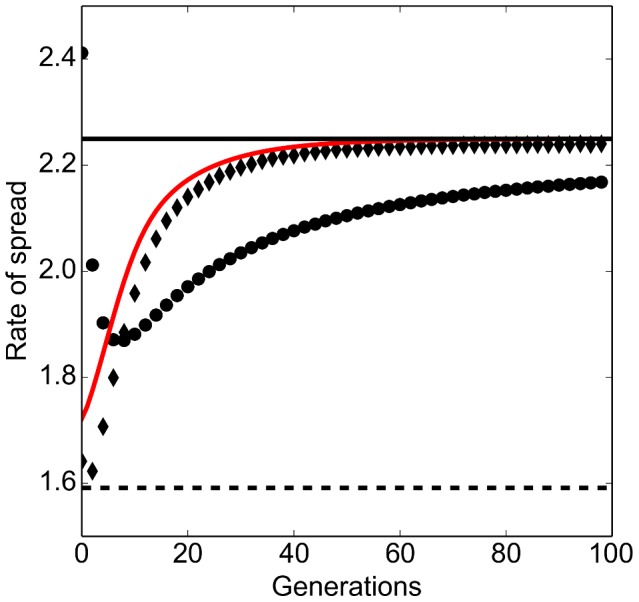
Figure 5. Rate of spread of a mixed population.

Parameter values are  . Diamonds: Instantaneous rate of spread. Circles: Average rate of spread. Solid black line: Predicted asymptotic rate of spread. Solid red line: predicted instantaneous rate of spread (Eq (10)). The rate of spread predicted by a single population model is shown by the dashed line.
