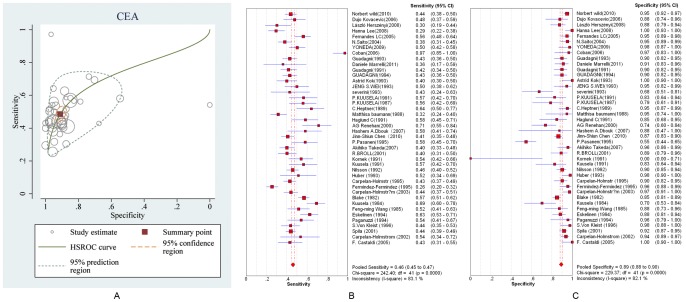
Figure 3. The ROC and forest plots of summary estimates of sensitivity and specificity of diagnostic marker CEA.
A is the ROC plot of the hierarchical summary estimates of sensitivity and specificity for CEA with 95% confidence and prediction ellipses. B and C are forest plots of sensitivity and specificity of the diagnostic marker CEA for colorectal cancer plotted with a HSROC model. The size of the squares in B and C are proportional to the study size and weight for each study. The rhombus represents the pooled estimates, which are 0.461 (CI: 0.448–0.474) and 0.892 (CI: 0.882–0.902) for specificity and sensitivity, respectively.

