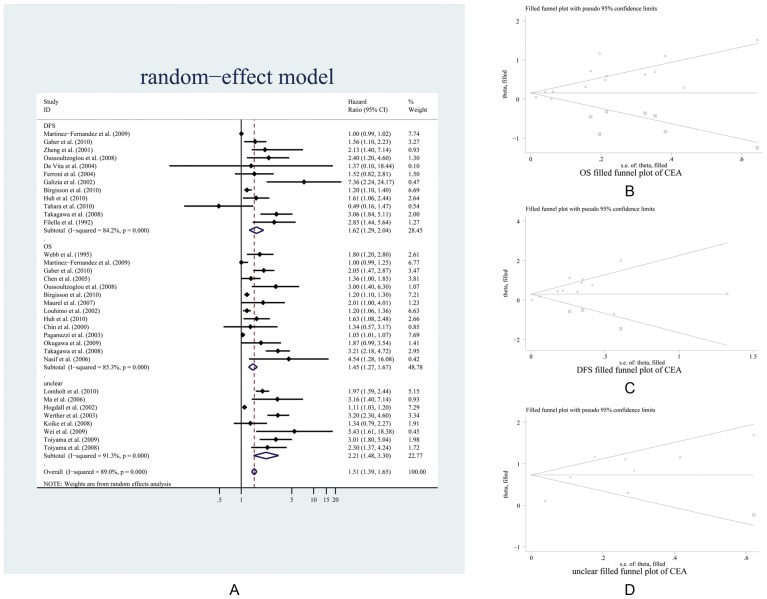
Figure 4. Meta-analysis plots of the progression-free and overall survival hazard ratios in individual trials.
A is the forest plot and B, C, and D are the “filled” funnel plots of OS, DFS, and the unclear group, respectively. The meta-analysis displayed a significant effect in favor of a high volume. The pooled and filled results are presented in Table 2.

