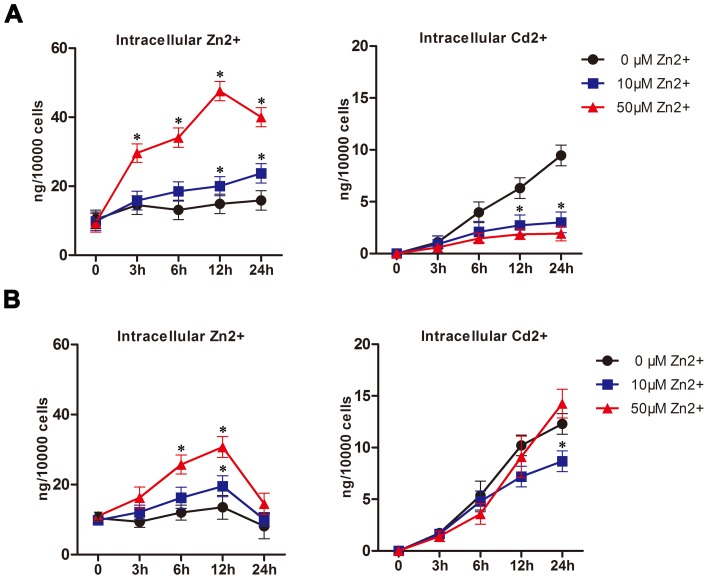
Figure 5. Quantification of intracellular Cd2+ and Zn2+.
MDBK cells were treated with 10 μM (A) or 50 μM (B) Cd2+, alone or in combination with Zn2+ (0, 10, or 50 μM). At the indicated time points, the intracellular levels of Zn2+ and Cd2+ (ng/1×104 cells) were determined by ICP-MS, as described in the Materials and Methods section. The results represent the mean ± SD (n = 4). *P<0.05, compared to the cells without Zn2+ supplementation.

