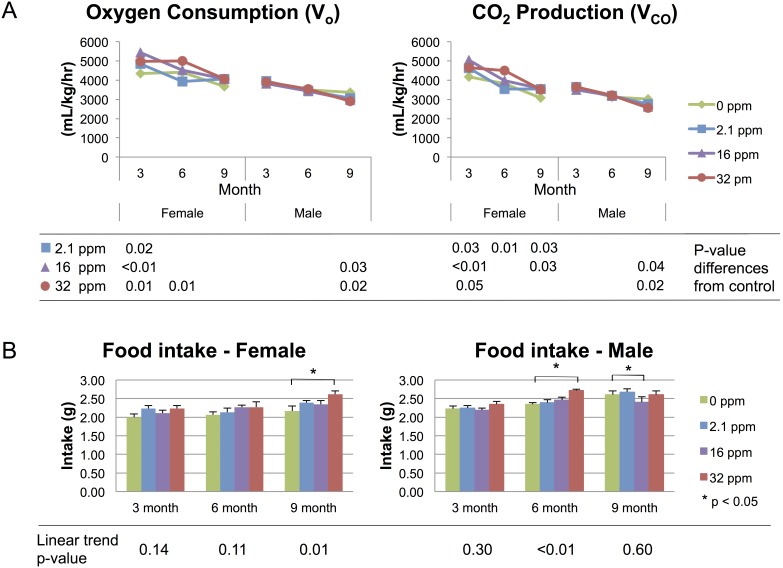
Figure 2. Energy Expenditure and Food Intake.
Energy expenditure (mL/kg/hr) measured over a 72-hr period by indirect calorimetry. (A) Oxygen consumption and carbon dioxide (CO2) production decline with age, across both sexes and all exposure groups. P-values represent differences from control. (B) Food intake across the life-course, stratified by sex. Stars indicate p-values<0.05 as compared to control. Linear trend p-values represent exposure-dependent trend significance.

