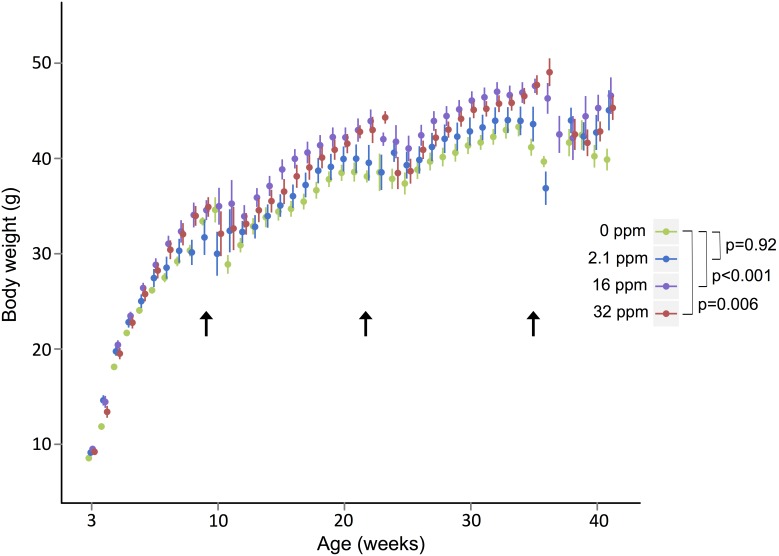
Figure 3. Weekly Body Weight Measurements.
Male offspring across all exposure groups (grams) were weighed. Both medium and high exposure groups are significantly increased in weight across the life course as compared to control mice (in green). Arrows indicate weeks when mice were transferred for physiological parameter testing resulting in stress-induced weight loss. Bars represent 95% confidence intervals. P-values were obtained by adjusting for litter, and the autoregressive structure within mice, and adjusting for week using indicator variables for week of measurement.

