
Figure 2. Modeling approach decomposed into 4 steps.
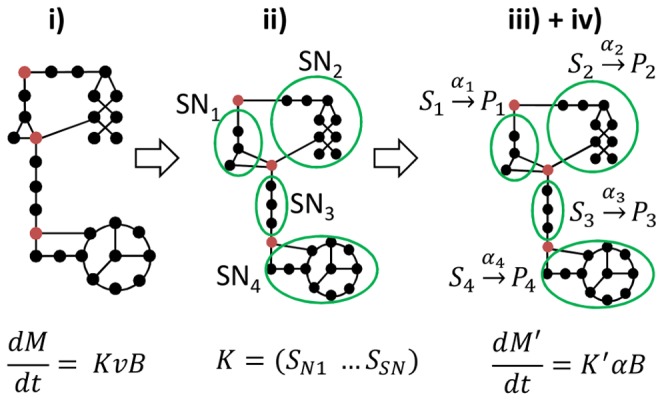
The complete network (step i) is decomposed into sub-networks (SN) assumed at quasi-steady state (step ii). These are reduced to a set of macroscopic reactions ( ) (step iii), for which kinetics are defined (step iv). Linking metabolites interconnecting the SN are allowed to accumulate (red circles) or be reused, which gives the dynamics of the whole network. From step iv), an ordinary differential equation (ODE) system is obtained, representing evolution of the macroscopic scale of the bioprocess as well as intracellular processes and accumulation of metabolites. In the full model described in step i),
  ,
, , while for the resulting model provided by our approach,
  and
and  , such that
  and
and  .
.